At LaDucTrading, I analyze price patterns and intermarket relationships across stocks, commodities, currencies and interest rates. I develop macro investment themes to identify tactical trading opportunities and employ strategic technical analysis to deliver high conviction stock, sector and market calls. My annotated Charts are meant to do most of the talking and illustrate my Thesis, Trigger, Time Frames, Trade Set-ups and Option Tactics. When applicable, I note Unusual Option Activity (UOA) and Deal Flow. I also keep a Tally and follow a Trade Plan, both of which are made available to members. No proprietary indicators are used, just solid chart pattern recognition, volatility insight and some big-picture perspective thrown in. Don’t hesitate to contact me with questions or comments: [email protected].
The LaDucTrading Gone Fishing Newsletter is divided into basically three parts:
- Reflections and Inflections
- Events This Week and How I’m Trading It
- Macro Considerations
Reflections and Inflections
Remember last Sunday when I wrote “I want to be short oil, both technically and fundamentally…but I do not dare get in front of the OPEC meeting Monday in Russia”? Good call. Oil popped 10% last week, best week since December! Now what? I want to short. Having said that, this is not for the faint of heart, or wallet. We have continued ‘sanctions or sanction talk’ over Venezuela, Iran, now Russia. We had huge drawdowns in inventory last week, summer driving to drive up demand and oil production facilities going off-line soon for maintenance — all of which can continue to support and pop oil. Oh, and hedge funds are growing more speculatively long, although they are usually late. Not only all of that but OPEC and non-OPEC reps will meet in Abu Dhabi on Aug. 7-8 to discuss why some of them are falling behind in their pledges to cut production. Despite all of that bullish build-up, I smell danger in the oil patch: Very large UOA in $HYG puts; Very suspect inventory reports that will likely be revised; Very likely reversal in $CAD and $USD coming which would fight the lower-oil theme. And technically, the lower high on crude chart and very weak XLE bounce has me looking for a rug pull in WTIC USO XLE OIH etc.
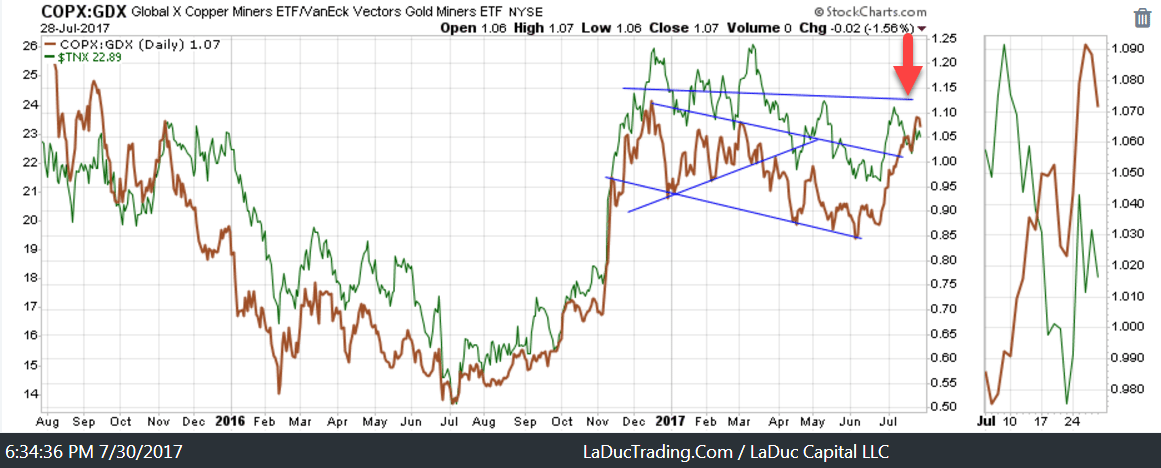
What else moved that was exciting last week? Copper exploded higher 5% one day and 3% the next on the prospects of greater demand from China infrastructure. But that didn’t help steel one bit, in fact, that whole SLX complex collapsed post US Steel’s earnings (which I feared) and as USDJDPY traced lower with Yen higher. The whole Reflation Trade in fact seems to be under attack: rates are lower since the FED downgraded their view on inflation at their FOMC meeting last week. And we won’t know what they think of inflation moving forward until their next meeting on September 19–20, or potentially before when they meet for Jackson Hole Symposium taking place August 24–26. Either way, they are worried about inflation and unless we get some rather exciting PMI numbers in the near future, we really don’t have inflation to fuel a Reflation Trade.
That view is not consensus by the way: Many, now, are espousing their views that money will rotate from the FAANG Tech stocks into beaten-down commodities, including oil. Um, actually, I did that the past few weeks… That’s because it technically seemed to make sense. But it’s a new month and I have a new mantra: Tech AND Commodities can both weaken in August. I’ll get to Tech in a moment but first here’s my take on Commodities: they have a long way to prove themselves and I do not believe they are done going down. I do believe they will be the trade of the decade once they turn, but I see no confirmation of this yet. And trust me, I am looking. One thing that would help is a Macro Theme to support it: our FED actually raising rates, not just normalizing their balance sheet; other developed countries raising rates, especially the overtly manipulative BOJ; emerging market raising rates which is the opposite of what they are doing. In short, a good macro theme to support higher inflation expectations can be based on more infrastructure spending, and yes tax cuts, or the like which ACCOMPANIES a stronger economy. That should lead to higher interest rates (which we do not have) and, most likely, a stronger dollar (which we do not have), and it should also be better for stocks tied to base metals like aluminum, copper, and steel (which we have and therein lies the divergence). In short, that divergence, and my expectation that rates will fall before they rise, is why I do not trust the ‘reflation’ trade in the coming month.
Reflation Charts That Make Me Go Hmmm
In the history of tracking HYG to XLE, there is no greater divergence:
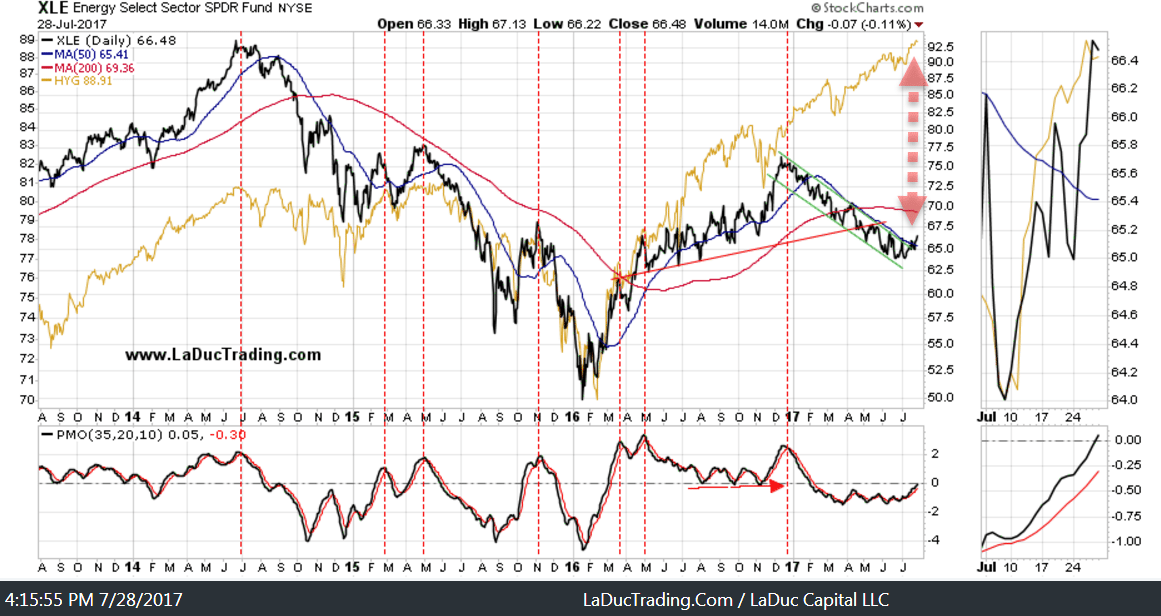
Higher bond market can lead to higher commodities and both can pull yields higher. Since industrial and precious metals are so closely correlated with rates, I track the relationship closely. Rates in the 10 year, along with this ratio, look headed down to at least retest support where they broke out last month.
Events This Week and How I’m Trading It
Economic Reports
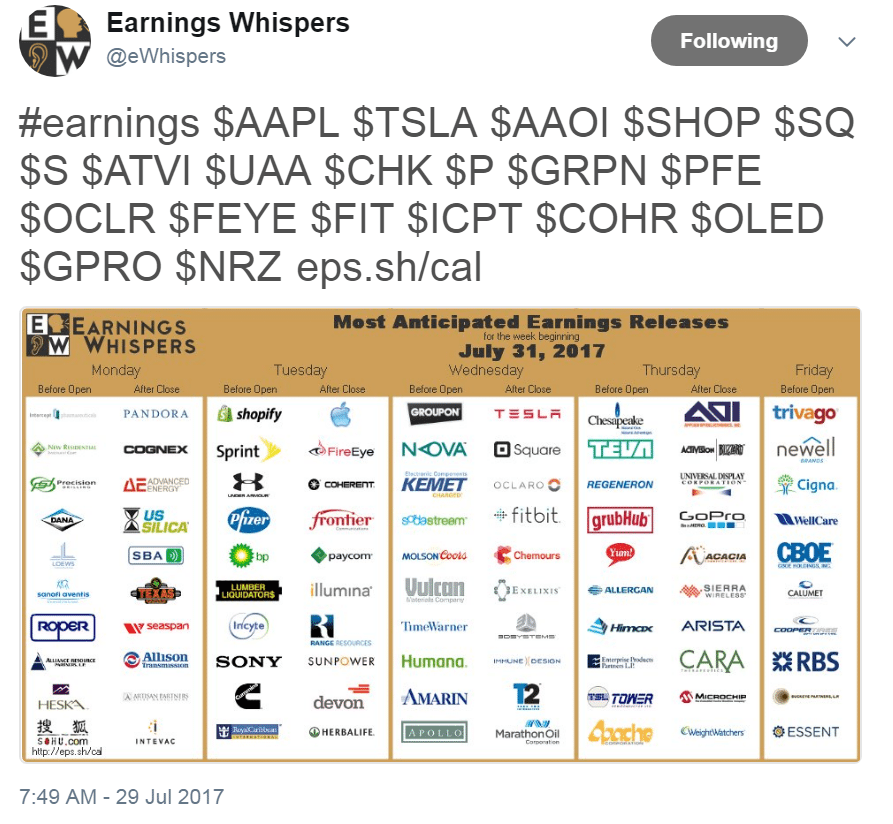
We are embarking on another heavy week of earnings reports with the biggest being AAPL after market close on Tuesday. The expected move ~4% should move the market one way or the other, after it not moving for weeks. The next most anticipated report is from TSLA on Wednesday. In the same way I was bearish GOOGL, which reported a 23% drop in earnings, to the AMZN short revealed last week pre-EPS, I am also dubious that either of these two Tech names (one more value, the other more growth) will impress. But what I am watching even more closely will be the overall reaction to the reports, especially heavy this week, from small and mid cap names.
The first week of a new month is of course NFP week and just so happens there are lots of potential currency moves in the making. The AUD rate decision could halt its 10% advance from the past three months. In the same way they Eurozone GDP and BOE rate decision could halt the EUR move of more than 10% advance. Since the week ends with the Canadian and US Employment picture, will their print potentially reverse CADs 10% rise as well? Will a strong US ISM PMI print, in combination with our NFP, and the above currency moves, reverse the USD trend which has fallen almost 10% this year in reaction to the others? Are you ready if they do?
Sunday: Japan Industrial Production, China Manufacturing PMI, Services PMI
Monday: Japan Housing Starts, Germany Retail Sales, Unemployment Rate, Italy PPI, Unemployment Rate, Eurozone Flash CPI, US Chicago PMI, Pending Home Sales, Korea CPI, Trade Balance, China Caixin Manufacturing PMI
Tuesday: Japan BOJ Core CPI, Eurozone PMI’s, US Personal Income/spending, Manufacturing PMI, ISM Manufacturing Index, Construction Spending, API Crude Inventories
Wednesday: Japan Consumer Confidence, Spain Unemployment Change, UK Construction PMI, Eurozone PPI, US ADP Employment Report, DOE Crude Inventories, Australia Trade Balance, China Caixin Services PMI
Thursday: Eurozone Services PMI’s, Retail Sales, US Jobless Claims, Services PMI, ISM Non Manufacturing Index, Factor Orders, Australia Retail Sales
Friday: Germany Factory Orders, Construction PMI, Spain Industrial Production, Italy Retail Sales, US Non Farm Payrolls, Average Hourly Earnings, Unemployment Rate, International Trade
Bullish or Bearish
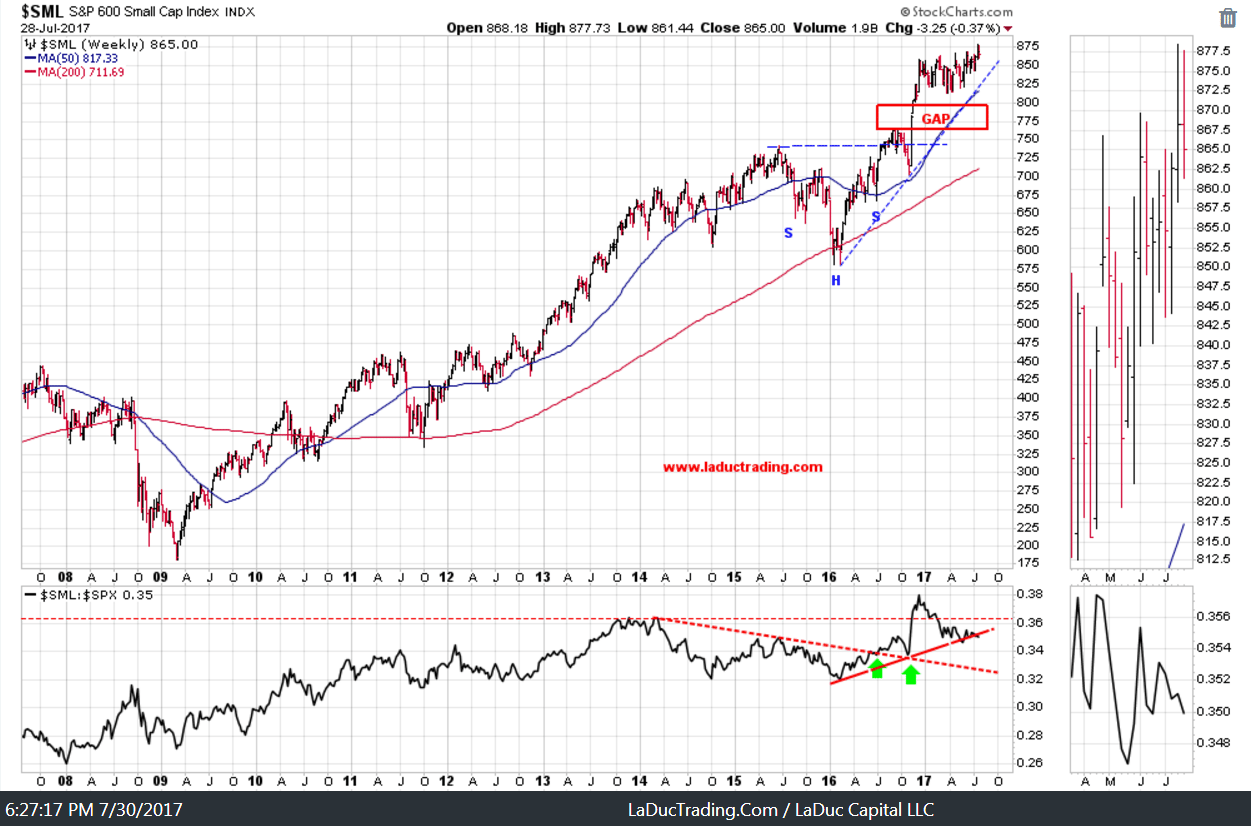
You can hopefully see from this chart why I will be watching the reaction to earnings from so many small-to-mid cap companies this week. SML is a slice of IWM but both have the same chart practically: gaps below to fill and relative weakness to SPX which could foretell a fall, in all.
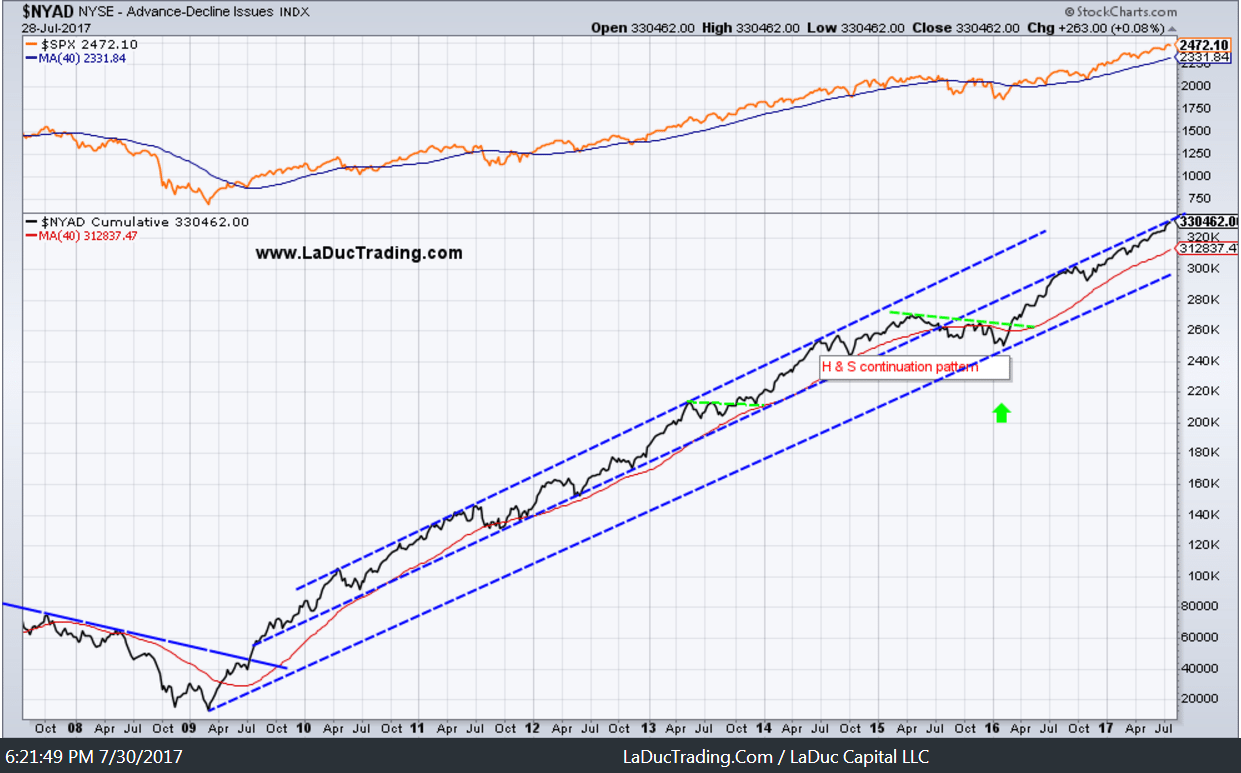
The NYSE advance-decline index has been in a beautiful 45% channel since 2009 lows, save two years from 2014-2016. The problem I see is that it is now hitting its head up against the underside of the middle trend line which could foretell resistance and possible pullback to the 40D, in time.
This is a really busy chart but suffice it to say that it has not triggered short since March of this year, when we pulled back 3.4% in DIA and 3% in SPX.
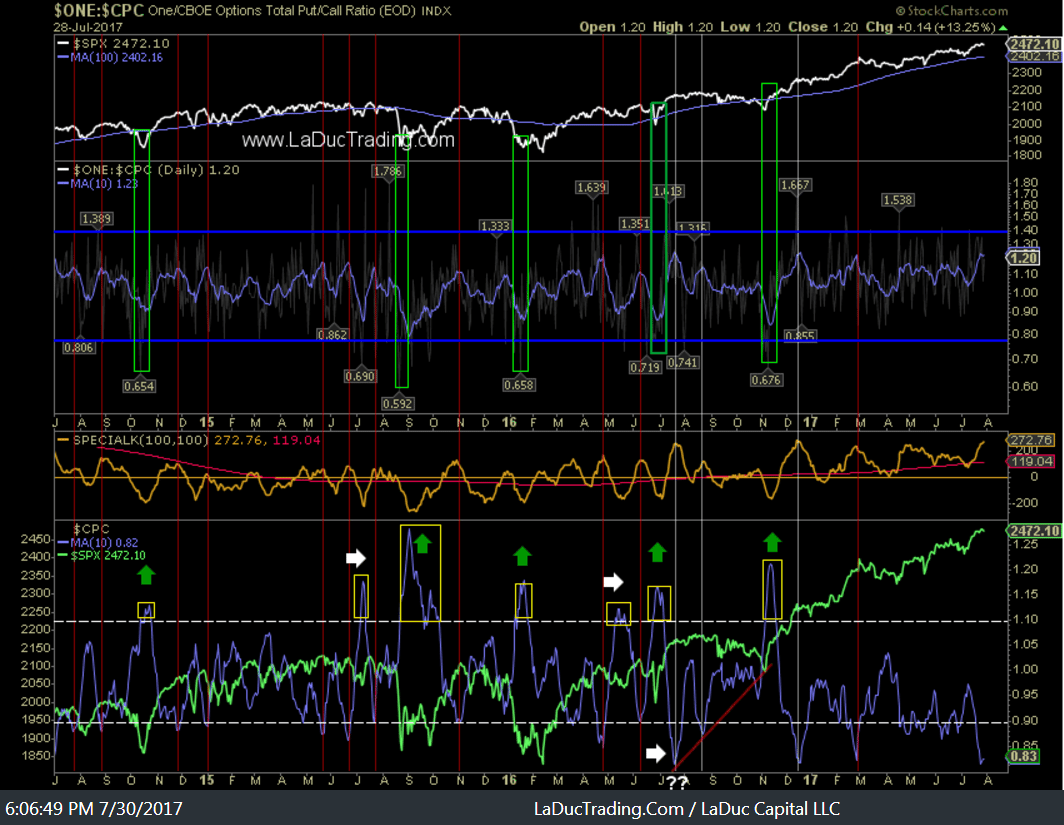
This is less busy but hopefully expresses a similar theme: Subdued volatility has been market-bullish. I contend Volatility may be picking up soon as ‘the volatility index of the volatility index’ approaches the apex of this descending wedge, and with it, the market pulling back.
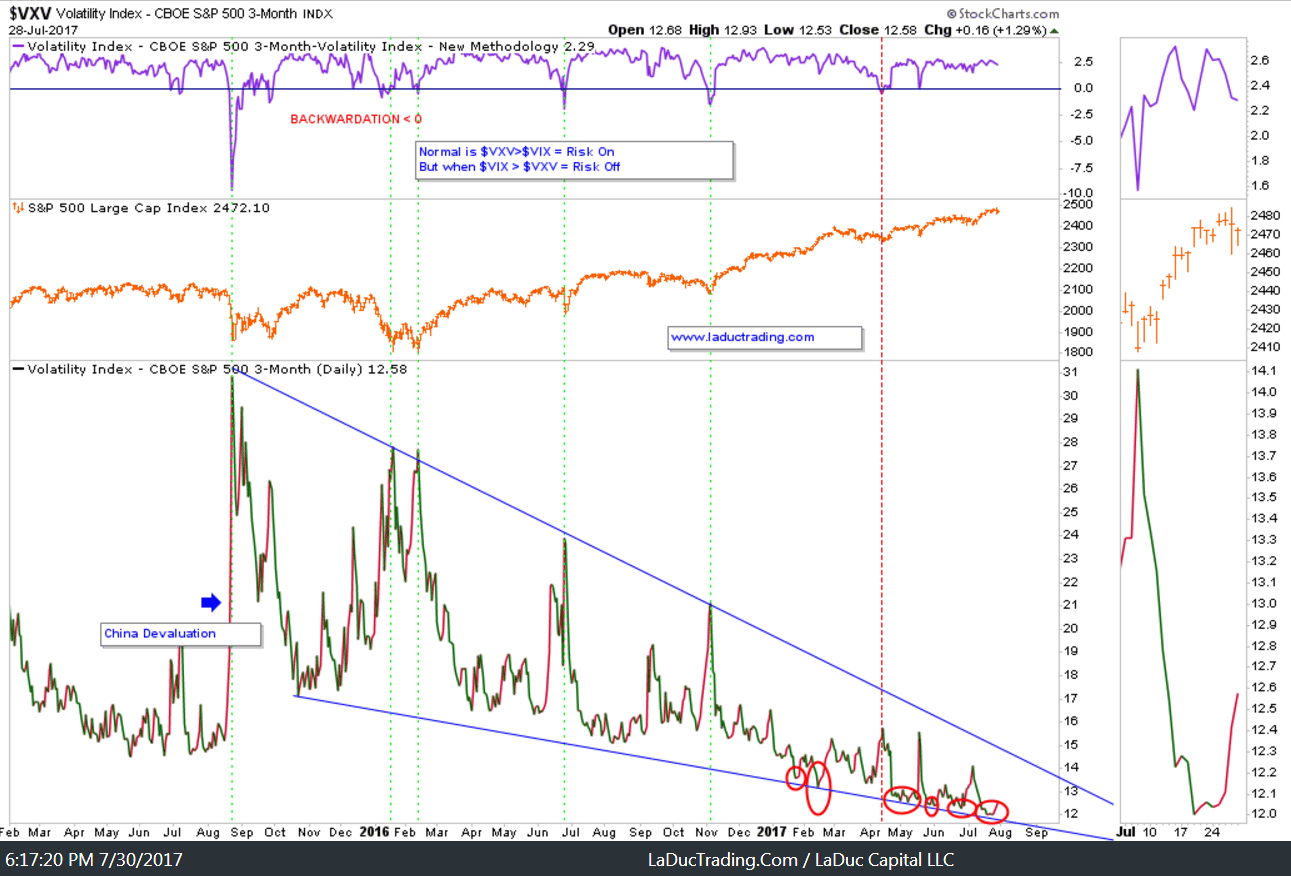
Speaking of volatility, did you know that 2017, by historical standards, stands alone as the year that global volatility stopped?
The Lack Of A Pullback Is A Global Thing
Earnings Reports
Here are the Majors for next week along. For a look at average expected moves compared to last quarter: cheat sheet here.

Member Trading Video
Member Trading Video will be sent separately with trading notes to accompany it.
Macro Considerations
The S&P and Air Pockets
Deflation of consumer prices is good (for purchasing power, real incomes, exporting). Deflation of asset prices is bad (for wealth, debt repayment, credit worthiness). You have no doubt read of Central Bank policies to keep rates in ‘perpetual’ deflation which has stimulated massive wealth inequality, fueled by soaring stock prices. I really don’t feel the need to rehash them. What I would like to demonstrate, through a few concrete examples, is why the SPY may be comprised of many overvalued asset prices, and that there is an “air pocket” of valuation that will likely be reset at some point.
Thanks to @philstockworld for pointing this out:
Apple (AAPL) is the top component of the S&P. With an almost $800Bn market cap, it makes up 3.7% of the index. In 2015 they had $233Bn in sales and made $53Bn, last year they had $215Bn in sales and made $45Bn and this year they are looking for $220Bn in sales and $46Bn in profit yet AAPL is trading 60 points higher (66.6%) than it was at the beginning of last year (after 2015 earnings were reported). What has AAPL actually done to justify a 66% gain? Mostly, it was drastically undervalued but, other than that – it has added no profits to the overall S&P. In fact, it has subtracted them!
Microsoft (MSFT) is the 2nd largest component on the S&P 500 at 2.7% of the index ($573Bn market cap) and, in 2015, they had $93Bn in sales and $12.2Bn in profits while in 2016, sales fell to $85Bn but they did manage $16.7Bn in profits – up 37% and this year flat but it’ a big, flat number, so who’s going to complain? MSFT has gained 50% over that time.
So if the top 10 S&P 500 components account for 20% of the index, and collectively these companies have only grown their earnings 4.7% in two years but the market is up 21%, that’s an “air pocket”.
Macro Read of the Week:
What’s wrong with Corporate Profitability? Gary Gordon proposes that the biggest risk of losing money in stocks today has little to do with corporate profits, although he demonstrates what’s wrong with corporate profitability, and more to do with the possibility of central bank policy error.
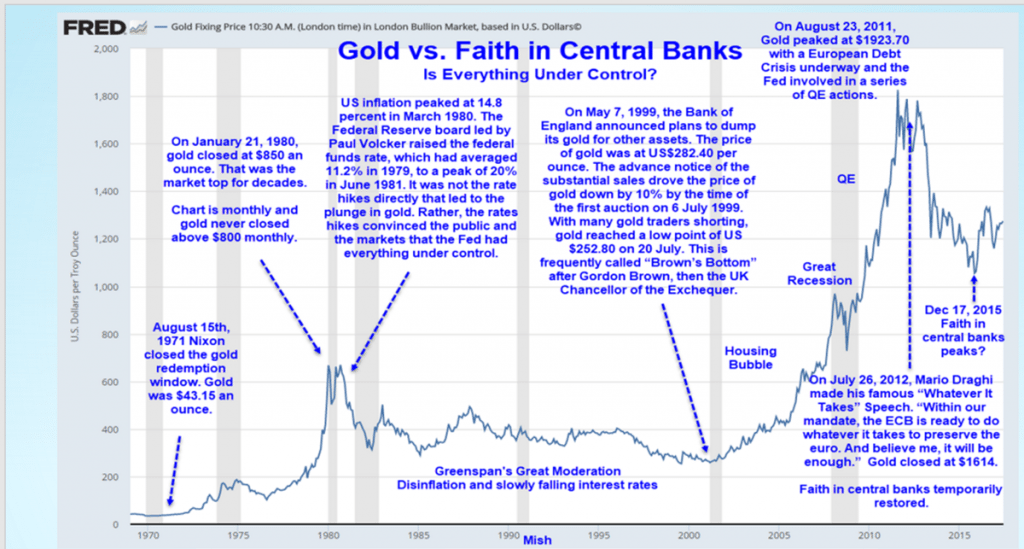
Macro Chart of the Week:
Contrary to popular belief, Gold is not an inflation hedge. We had rampant inflation from 1980 to 2000 but gold fell from $850 to $250. Gold tends to perform poorly during inflation and disinflation, a falling but positive rate of inflation as measured by the CPI. Gold tends to do best in deflation and times of credit stress which can be summed up when confidence in central banks is on the wane. So higher gold, now, isn’t exactly market-bullish.


Feedback and Referrals
I value your feedback. Let me know how I can help!
I value referrals. Let others know I am here to help!